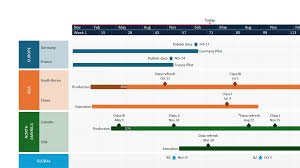
Managing projects often involves handling large amounts of data, and Excel is a popular tool for this purpose. However, presenting this data clearly and engagingly can be challenging. This is where Office Timeline comes in. It allows you to transform your Excel data into visually appealing timelines directly within PowerPoint, making it easier to communicate project plans and progress to stakeholders.
Step 1: Prepare Your Excel Data
Before importing your Excel data into Office Timeline, it’s essential to organize it correctly. Here’s how to set up your spreadsheet:
- Title: Each task or milestone should have a clear title.
- Start Date and End Date: These columns define the duration of each task.
- Row ID: Assign a unique identifier to each task or milestone. This helps in updating the timeline later if the data changes.
- % Complete (Optional): Indicates the progress of each task. Enter only the numerical value without the “%” symbol.
- Notes (Optional): Additional information about the task. These notes will appear in the Edit Data window but won’t be visible on the timeline itself.
- Swimlanes (Optional): If your project involves multiple teams, you can categorize tasks into swimlanes for better clarity.
Ensure that your data is clean and free from errors to facilitate a smooth import process.
Step 2: Import Data into Office Timeline
Once your Excel data is ready, follow these steps to import it into Office Timeline:
- Open PowerPoint: Launch Microsoft PowerPoint and open the Office Timeline add-in.
- Select Import: Click on the ‘Import’ button in the Office Timeline ribbon.
- Choose Excel: From the options, select ‘Microsoft Excel’ to import your data.
- Upload File: Browse to your Excel file and select it for import.
- Select Worksheet: If your Excel file contains multiple sheets, choose the one you wish to import.
Office Timeline will automatically detect the columns in your Excel file and map them to the appropriate fields.
Step 3: Map Your Data
Mapping your data ensures that each column in your Excel file corresponds correctly to the fields in Office Timeline. Here’s how to map your data:
- Title: Ensure this is mapped to the ‘Title’ field.
- Start Date and End Date: Map these to the respective date fields.
- Row ID: Map this to the ‘Row ID’ field.
- % Complete: If you included this column, map it to the ‘% Complete’ field.
- Notes: Map this to the ‘Notes’ field.
- Swimlanes: If applicable, map these to the ‘Swimlane’ field.
After mapping, you can preview how your timeline will look. Make any necessary adjustments before proceeding.
Step 4: Select Rows to Import
In this step, you can choose which tasks or milestones to include in your timeline:
- Select All: If you want to include all rows, click the ‘Select All’ checkbox.
- Deselect: To exclude specific rows, uncheck the corresponding boxes.
- Filter: If your Excel file contains a large amount of data, use the filter option to display only the rows you need. You can apply up to three filters simultaneously to refine your selection.
Once you’ve selected the desired rows, proceed to the next step. support.officetimeline.com
Step 5: Generate Your Timeline
After selecting the rows to import, click the ‘Import’ button. Office Timeline will generate a timeline based on your Excel data. You can then customize the appearance of your timeline by:
- Choosing a Theme: Select a theme that aligns with your presentation style.
- Adjusting Colors: Modify colors to differentiate between tasks or phases.
- Adding Labels: Include labels to provide additional information about each task or milestone.
These customization options help make your timeline more engaging and easier to understand.
Step 6: Update Your Timeline
As your project progresses, your Excel data may change. To keep your timeline up to date:
- Update Excel File: Make the necessary changes in your Excel file.
- Refresh Timeline: In PowerPoint, open the Office Timeline add-in and click on the ‘Refresh’ button. Office Timeline will update the timeline to reflect the changes in your Excel data.
Tips for Effective Timelines
- Keep It Simple: Avoid cluttering your timeline with too much information. Focus on key tasks and milestones.
- Use Colors Wisely: Use colors to differentiate between different phases or teams, but avoid using too many colors, as this can be distracting.
- Regular Updates: Regularly update your timeline to reflect the current status of your project.
- Feedback: Share your timeline with stakeholders and gather feedback to improve its clarity and effectiveness.
Conclusion
Importing Excel data into Office Timeline is a straightforward process that can significantly enhance the way you present project information. By following these steps, you can create clear, visually appealing timelines that make it easier for stakeholders to understand your project’s progress and status. Remember to keep your data organized, map it correctly, and customize your timeline to suit your needs. With Office Timeline, transforming your Excel data into a compelling visual narrative is just a few clicks away.


